disable copy

Sunday, 31 January 2021

 The table below shows the sales at a small restaurant in a downtown business district.

Summarize the information by selecting and reporting the main features, and make comparisons where relevant.

 You should write at least 150 words.


Sales: week of October 7-13


Mon.

Tues.

Wed.

Thus.

Fri.

Sat.

Sun.

Lunch

$2,400

$2,450

$2,595

$2,375

$2,500

$1,950

$1,550

Dinner

$3,623

$3,850

$3,445

$3,800

$4,350

$2,900

$2,450


The given table significantly illustrates the information on sales of a small city centre restaurant in a typical October week starting from the 7th October and ending on 13th October. Units are measured in dollars.


Overall, it is crystal clear that the sales during the dinner time is much higher than lunch, also, the sale during the weekend is much lower as compared to weekdays.


It is evident that the sale amount for lunch during the weekdays (Monday to Friday) ranges between 2400 to 2500 dollars, however, the sale on Saturday and Sunday fall much beyond that range at 1950 and 1550 dollars respectively. On Monday, the restaurant sells lunch for 2400 dollars and the sale reaches the peak of 2595 on Wednesday. The sale then falls down a bit on Thursday and recover back to 2500 level on Friday.


however, the sale is much higher the whole week compared to the lunch sale. Nevertheless, comparing weekdays and weekend sales, the pattern is similar as it is for lunch sales. If we look at weekday sales trend, it is obvious that the sales are quite erratic. On Monday, the restaurant makes a sale of 3623 dollars from dinner and on Tuesday it goes up a bit but on Wednesday. It touches the lowest level of the weekday at 3445 dollars then it recovers and reaches a peak of 4350 dollars on Friday.

 The take below gives information about the underground railway systems in six cities. Summaries the information by selecting and reporting the main features, and make comparisons where relevant. You should write at least 150 words.

Underground Railways Systems


City

Date opened

Kilometers of route

Passengers per year
(in millions)

London

1863

394

775

Paris

1900

199

1191

Tokyo

1927

155

1927

Washington DC

1976

126

144

Kyoto

1981

11

45

Los Angeles

2001

28

50


The given table significantly illustrate the details regarding the underground railway systems in six cities. Units are measured in millions.


Overall, the underground railway systems in different cities vary a lot in the site of the system, the number of passengers served per year and in the age of the system.


https://www.youtube.com/watch?v=loZ7PdmSmi4&list=PL2SnntlB81Ylj8mmaLJphiN9LHvt0LTWF

It is evident that London has the oldest underground railway systems among the six cities. It was opened in the year 1863, and it is already lye years old. Paris is the second oldest, in which it was opened in the year 1900. This was then followed by the opening of the railway systems in Tokyo, Washington DC and Kyoto. Los Angeles has the newest underground railway system, and was only opened in the year 2001. In terms of the size of the railway systems, London, for certain, has the largest underground railway systems. It has 394 kilometers of route in total, which is nearly twice as large as the system in Paris. Kyoto, in contrast, has the smallest system. It only has 11 kilometers of route, which is more than 30 times less than that of London.

However, Tokyo, which only has 155 kilometers of route, serves the greatest number of passengers per year, at 1927 million passengers. The system in Paris has the second greatest number of passengers, at 1191 million passengers per year. The smallest underground railway system, Kyoto, serves the smallest number of passengers per year as predicted.

The table below shows the percentage of mobile phone users using various mobile phone features. Percentages of mobile phone users using distinct mobile phone features. Summarize the given table. IELTS I IELTS ACADEMIC TASK-1

 The table below shows the percentage of mobile phone users using various mobile phone features. Percentages of mobile phone users using distinct mobile phone features. Summarize the given table.

Feature

2017

2018

2019

Make Calls

100

100

100

Send & Receive messages

98

92

94

Take photos

60

72

90

Browse Internet

80

85

92

Play MP3

40

68

80

Record Video

No data

20

31

Online Shopping

36

65

83

Money Transfer

No data

57

78

File Transfer

9

38

62


The given table significantly illustrates the share of mobile phone users using distinct features in 2017, 2018, and 2019. Also, it depicts information about various function types used by mobile phone users across 9 categories in three specific years 2017, 2018, and 2019. Units are measured in percentage.


Overall, it can be observed that the most frequent usage of the mobile phone was to make calls. Also observed that only fewer figures for browsing the internet, moreover, the file transfer is very less in 2017.

https://www.youtube.com/watch?v=loZ7PdmSmi4&list=PL2SnntlB81Ylj8mmaLJphiN9LHvt0LTWF

It is evident that in each of these years, the mobile use for calling was significantly higher than the other eight functions, with 100% usage levels in all the three years.  The other features include sending and receiving text messages, taking photos, playing music, file transfers, money transfers all had a slight increase in the frequency of usage percentage by mobile phone users.

On the other hand, it is clear that the money transfer had the largest rise in usage frequency starting with 9% in 2017. By 2019, this figure went up to 62% of the owners using the mobile phone for money transfer.


The table below shows the monthly expenditure of an average Australian family in 1991 and 2001.Summaries the information by selecting and reporting the main features, and make comparisons where relevant. Write at least 150 words.

 The table below shows the monthly expenditure of an average Australian family in 1991 and 2001.Summaries the information by selecting and reporting the main features, and make comparisons where relevant. Write at least 150 words.


The given table significantly illustrates data compare monthly expenses of an average family in Australia for the years 1991 and 2001. Units are measured in dollar per month.

Overall, monthly expenditure by an average Australian family had not increased that much in 10 years, from 1991 to 2001, and expenses on electricity, water, housing, and non-essential goods and services somewhat increased while the expenses on clothing and transport decreased over time.  


it is evident that, the average expenditure of an Australian family per month was AUD 675 in 1991 while this reached to AUD 715 after 10 years. This shows that the average expenditure of an average Australian family had not increased significantly. In 1991, the expenditure on non-essential goods and services was $250 which was the highest among the given categories. This reached to $270 in 2001 which was also the highest amount among the given expense categories in 2001.

On the other hand, the expenses on food & housing were $155 and $95 consecutively in 1991 and both of these expenses increased by only 5 dollars after 10 years 

https://www.youtube.com/watch?v=loZ7PdmSmi4&list=PL2SnntlB81Ylj8mmaLJphiN9LHvt0LTWF

Interestingly the monthly amount spent on clothing and transport decreased over the decade and reached to $20 and $45 in 2001. The expenses on food, housing and electricity & water increased and the highest increase was for electricity and water.

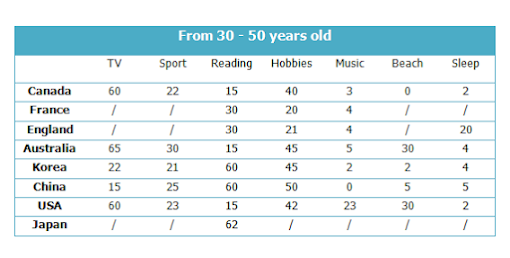
The table below gives information about Favorite Pastimes in different countries. Summaries the information by selecting and reporting the main features, and make comparisons where relevant. I IELTS I IELTS WRITING TASK-1 ACADEMIC

 The table below gives information about Favorite Pastimes in different countries. Summaries the information by selecting and reporting the main features, and make comparisons where relevant.


The given table significantly illustrates and compares favorable pastimes in eight different countries. The pastimes, across the top of the table, are analyzed in relation to each country. Units are measured in percentage.


Overall, it is crystal clear that TV remains most popular pastime activity in Australia and beach time is least opted by people.

It is evident that about 60% of Canadians, Australians and Americans like watching television. On the other hand, this figure is quite low for China where only 15% of people watch television. Predictably, Americans like music at 23%, whereas only 2 to 5% of people in the other countries feel the same way. 20% of people in England enjoy sleeping as a pastime whereas in Canada and the USA, for example, the figure is only 2%.

https://www.youtube.com/watch?v=loZ7PdmSmi4&list=PL2SnntlB81Ylj8mmaLJphiN9LHvt0LTWF

Interestingly, the Chinese like hobbies the most at 50%, as opposed to only 20% in France. It isn’t surprising that the highest percentage of beach-lovers is in Australia and the USA at 30%.


The chart illustrates the percentage of male and female executives in six different types of profession across the UK in 2007. Summarize the information by selecting and reporting the main features, and make comparisons where necessary. Write at least 150 words.

 The chart illustrates the percentage of male and female executives in six different types of profession across the UK in 2007. Summarize the information by selecting and reporting the main features, and make comparisons where necessary. Write at least 150 words.  


The given bar graph significantly analysis proportion of men and women executives in different kind of occupations namely advertising, teaching, construction, therapists, journalism, scientists and law around UK during 2007. Units are measured in percentage.


Overall, construction was most popular profession opted by males whereas teaching was highly preferred by females. Also, journalism remained equally famous among both genders.

https://www.youtube.com/watch?v=loZ7PdmSmi4&list=PL2SnntlB81Ylj8mmaLJphiN9LHvt0LTWF

It is evident that 90% of females and males opted teaching and construction their career while only 10% females selected construction as a profession and only 10% males go for teaching. 82% of women were therapists as against only 19% men who choose this occupation. More than a half of men adapted for Science and law stream than women which were less than 50% in this field.

On the other hand, same proportion (50%) of both sexes registered for journalism. As far as advertising is concerned, only 55% of women were in favor if this field however just 45% of males opted this field as their career.


The bar chart gives the top eight online activities in Slovakia in a given month. Summarize the information by selecting and reporting the main features, and make comparisons where necessary. Write at least 150 words Academic task-1

 The bar chart gives the top eight online activities in Slovakia in a given month. Summarize the information by selecting and reporting the main features, and make comparisons where necessary. Write at least 150 words


The given column graph significantly illustrates different types of activities of adults on internet in Slovakia during July. Units are measured in percentage.


Overall, email was the most popular activity among both genders whereas job hunting remained at last as against others. Moreover, remaining activities had minor difference between preference of men and women.

It is evident that more than 80% of males and females operate their tasks through e-mails, followed by text or instant messages which was used by approximately equal percentage of both sexes. 72% of males and 79%  females spend time using internet banking. Large majority of females (61%) were health conscious and does health research while this figure dramatically decreased to 33% regarding males.

However, more than a half of females enjoyed listening to music on the other hand there was a minimal drop of 3% in male’s proportion. Also, online education favored equally by both genders and job hunting was least surfed by adult males and females that is 26% and 27% respectively.

IELTS WRITING MATERIAL

Cause-effect, cause-opinion, effect-solution, Random two part question

  1. CAUSE–EFFECT ESSAY Typical question In many countries, people are suffering from increasing levels of stress. What are the causes of ...